
Cartographic Grounds: Projecting the Landscape Imaginary. (Photo: Princeton Architectural Press)
Continuing on the subject of maps, I recently came across a fascinating post on Atlas Obscura, describing the various kinds of maps used by cartographers. As Harvard landscape architecture professor and author Jill Desimini explains, maps must retain geographic fidelity, scale, and projection. However, the best ones, she continues, also have a visual clarity and graphic integrity equivalent to any art form.
Desimini and fellow Harvard professor Charles Waldheim explore 10 conventions that are essential to map making in their recently published book, Cartographic Grounds: Projecting the Landscape Imaginary. The book contains 275 pages of vivid maps with explanations detailing the methods used by their cartographers.
These conventions can help lead to more beautiful and informative maps, adding to the richness and diversity of representations of our world.
1. Sounding / Spot Elevation
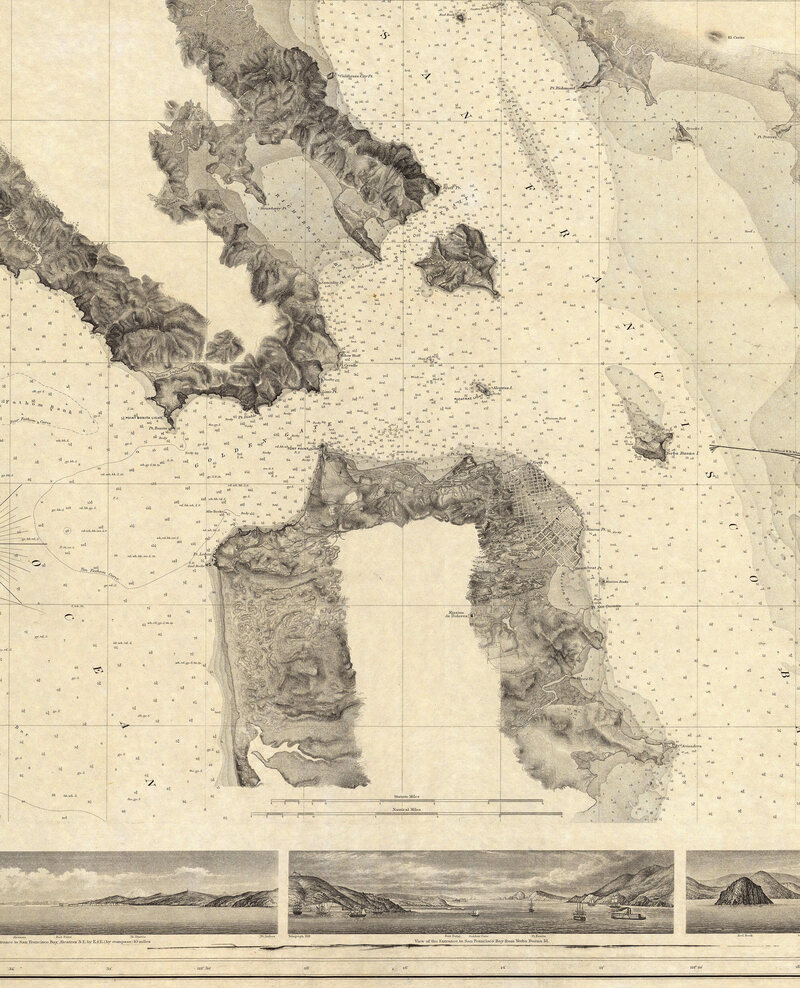
Alexander Dallas Bache, Entrance to San Francisco Bay California, 1859. (Photo: Harvard Map Collection/Harvard Library/Harvard University)
This cartographic component includes two measurements for showing depths and heights above and below sea level. “Soundings” pinpoint depths of water and are noted by a number on a nautical chart, while “spot elevations” are the numbers that show the position and altitude.
In this map, Alexander Dallas Bache, a cartographer who ran the NOAA Coast Survey from 1843 to 1867, rendered the San Francisco urban coastline, using spot elevations to depict the water’s edge.
2. Isobath / Contour
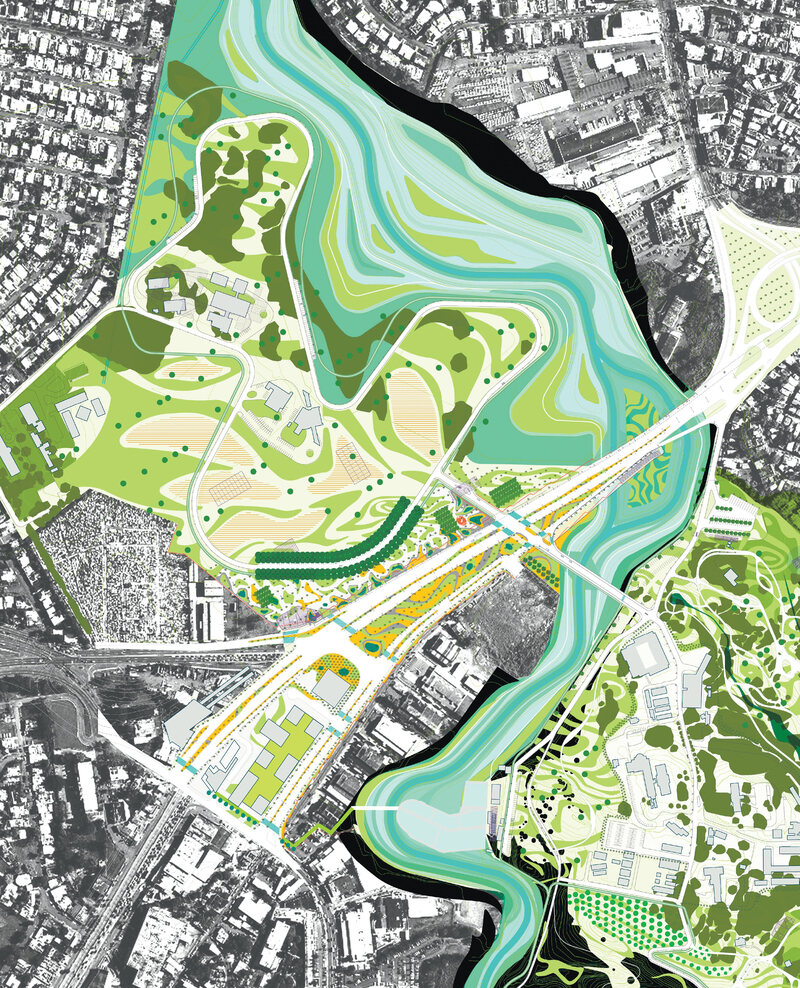
James Corner Field Operations, University of Puerto Rico Botanical Gardens, 2003–6. Scale: 1:2,500 (shown at half size). (Photo: © James Corner Field Operations)
Isobaths and contours are lines that connect points of equal value on maps, showing the morphology of the ground. The map of the University of Puerto Rico Botanical Gardens show a series of color ribbons and swaths that represent the topography.
3. Hachure / Hatch
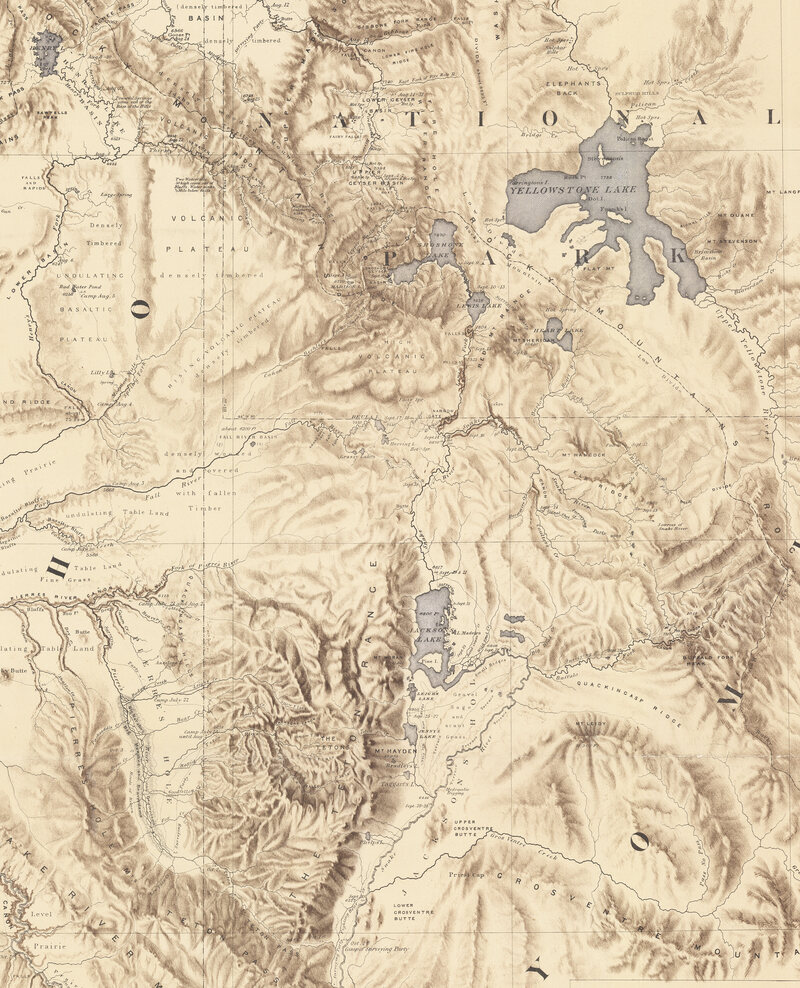
Gustavus Bechler, Map of the Sources of Snake River, 1872. (Photo: Harvard Map Collection/Harvard Library/Harvard University)
This convention is a series of short lines that perpendicularly fill the space between contours and show slope, shadow, relief, and texture. Topographer Gustavus Bechler designed this map of the sources of Snake River, which has hachures, or reliefs, that are “particularly soft and warm, allowing ridgelines to dissipate into plateaus,” Desimini and Waldheim write.
4. Shaded Relief
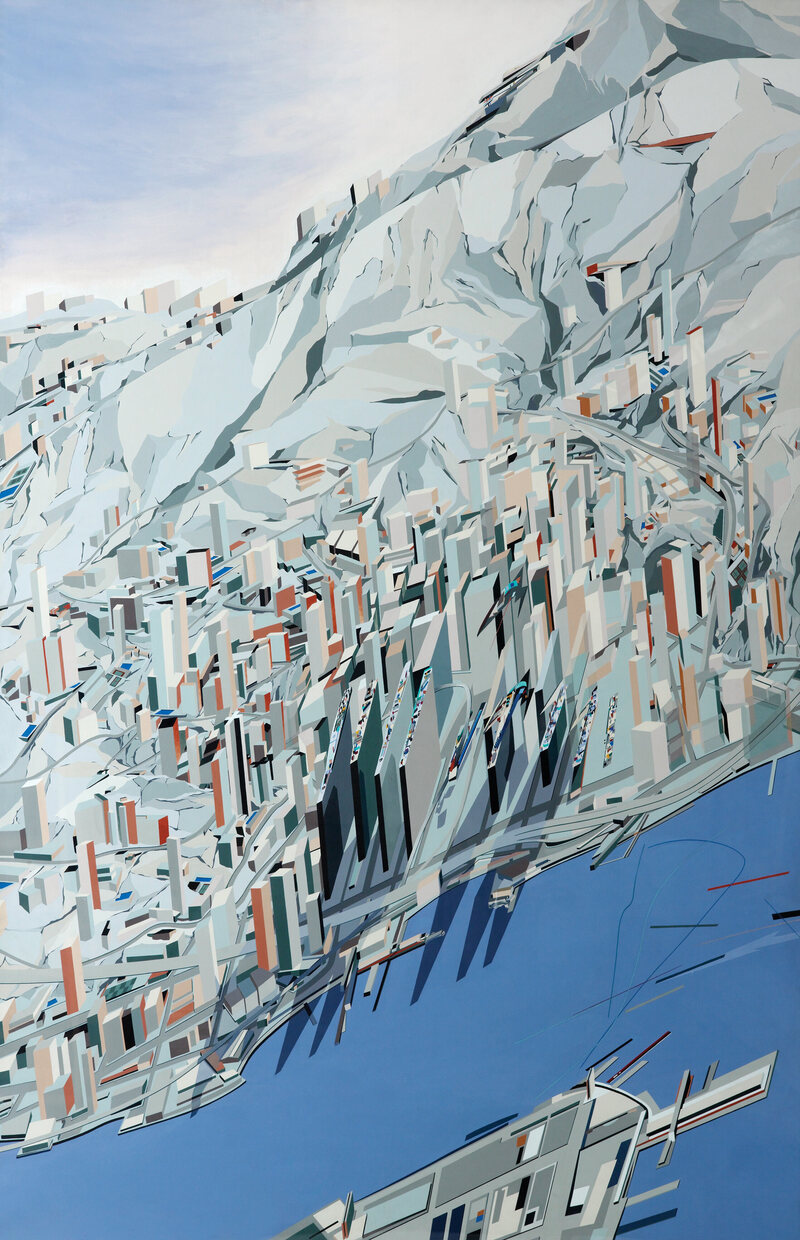
Zaha Hadid, The Peak, 1982–83. (Photo: Zaha Hadid Architects)
Shaded relief is the depiction of shadows with tonal gradients. This marks changes in elevation and landform in raised relief maps and models. The Blue Slabs painting from late architect Zaha Hadid’s The Peak shows an abstract block colorization of the sprawling city of Hong Kong. The shadows make the building beams look like they are flying from the cliffs.
5. Land Classification
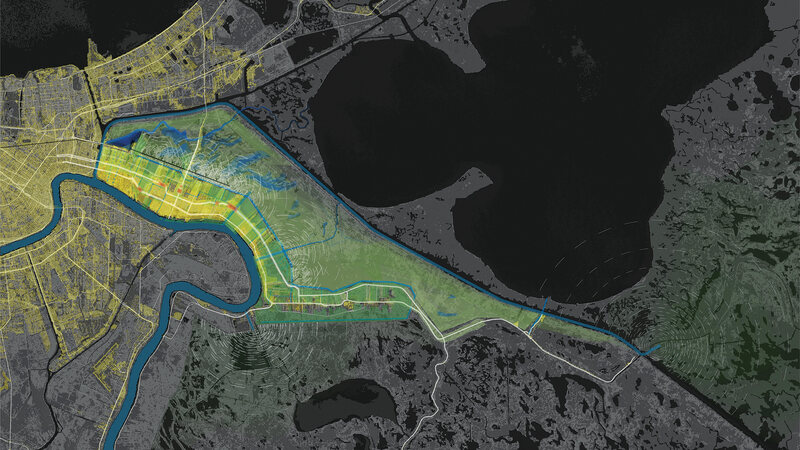
LSU Coastal Sustainability Studio, Bayou Bienvenue, 2010. (Photo: LSU Coastal Sustainability Studio)
This is the taxonomic method of describing spatial distribution of vegetation and agronomic land uses. It’s used to distinguish types of soil, vegetation, and activity. The image of greater New Orleans codes different projected land uses with colors and patterns.
6. Figure-Ground
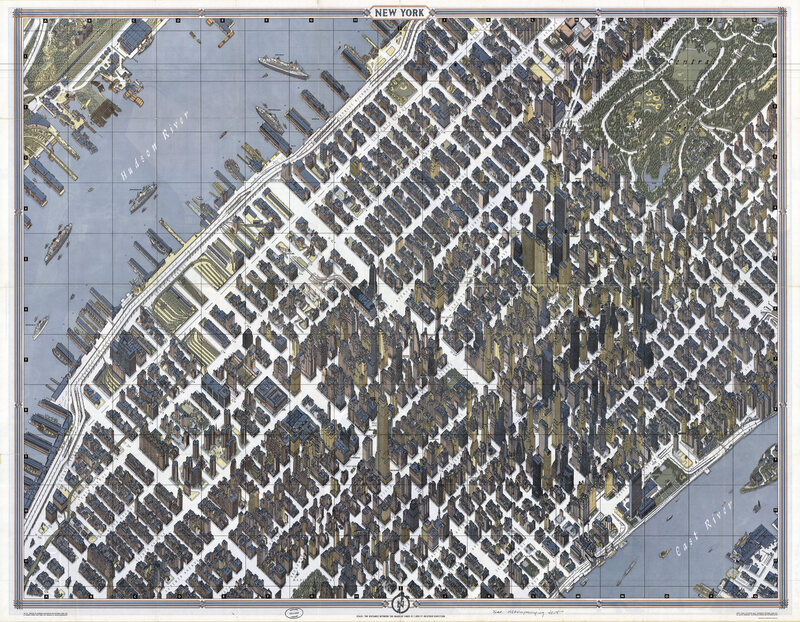
Herman Bollmann, New York, 1962. (Photo: © Bollmann-Bildkarten-Verlag, Braunschweig, Germany/Harvard Map Collection/Harvard Library/Harvard University)
This technique helps distinguish space, usually urban spaces, from other entities, such as a building and the rest of the urban environment. In this 1962 map created by German cartographer and graphic artist Herman Bollmann, the aerial view of New York City shows the high-rises without blocking the ground and streets. The map was made for the New York World’s Fair.
7. Stratigraphic Column
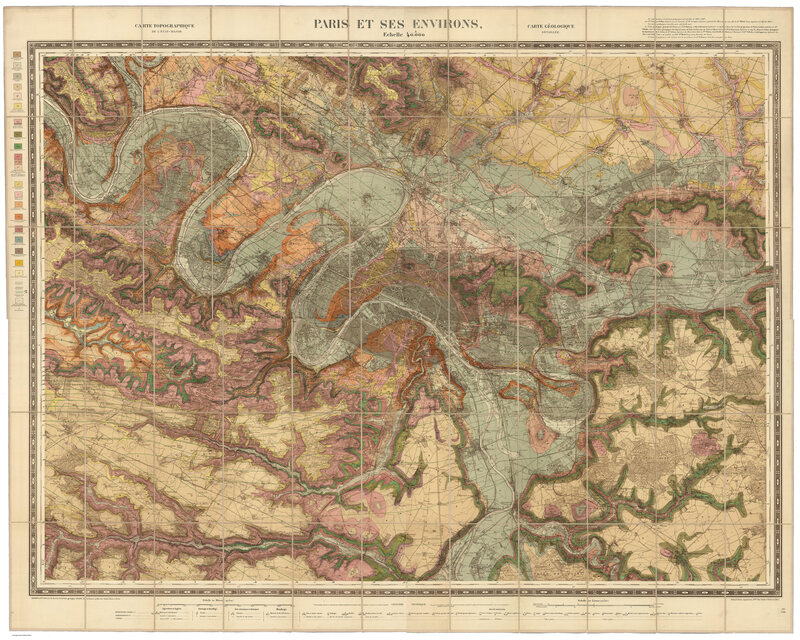
Service Géologique des Mines, Paris et Ses Environs, 1890. (Photo: The David Rumsey Map Collection)
Stratigraphic columns rely on color to show locations of rocks, visualize geologic time, and signify soil and sediment type. This extremely elaborate 1890 geological map of Paris shows known, invented, and hidden layers of underground rock with the city above.
8. Cross Section
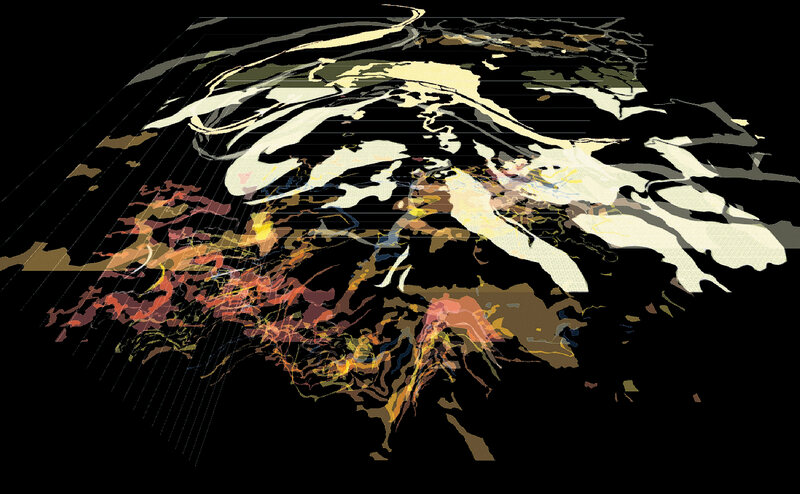
Robert Gerard Pietrusko, Animation Still, 2012. (Photo: Robert Gerard Pietrusko)
A cross section is a vertical slice through the Earth’s surface, which specifies elevation, depth, and structural and material composition.
9. Line Symbol
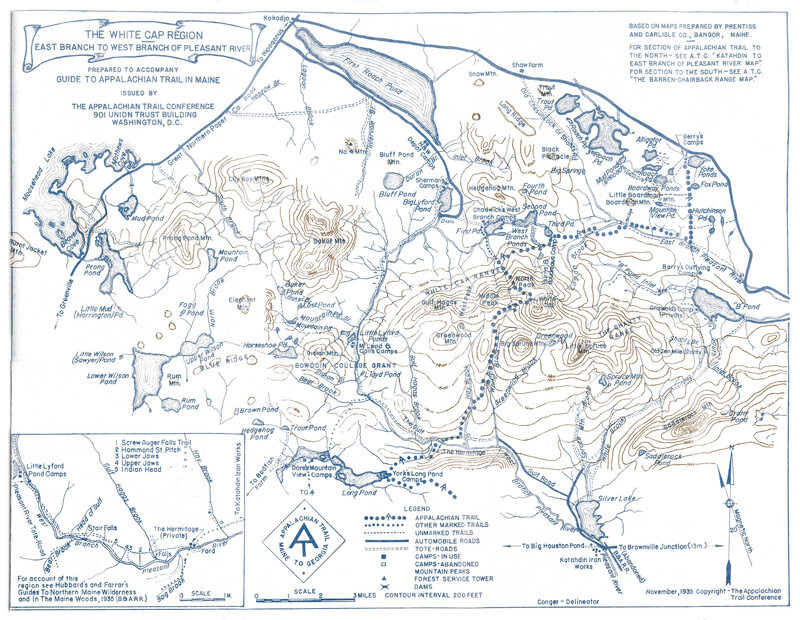
The Appalachian Trail Conference, Guide to the Appalachian Trail in Maine.(Washington, DC: The Appalachian Trail Conference, 1936). (Photo: The Frances Loeb Library/Harvard University Graduate School of Design/The Appalachian Trail Conservancy)
This cartographic convention marks off boundaries, borders, property lines, rivers, infrastructures, and routes. In this map of the Appalachian Trail in Maine, lines distinguish roads and trails from streams and mountains
10. Conventional Sign
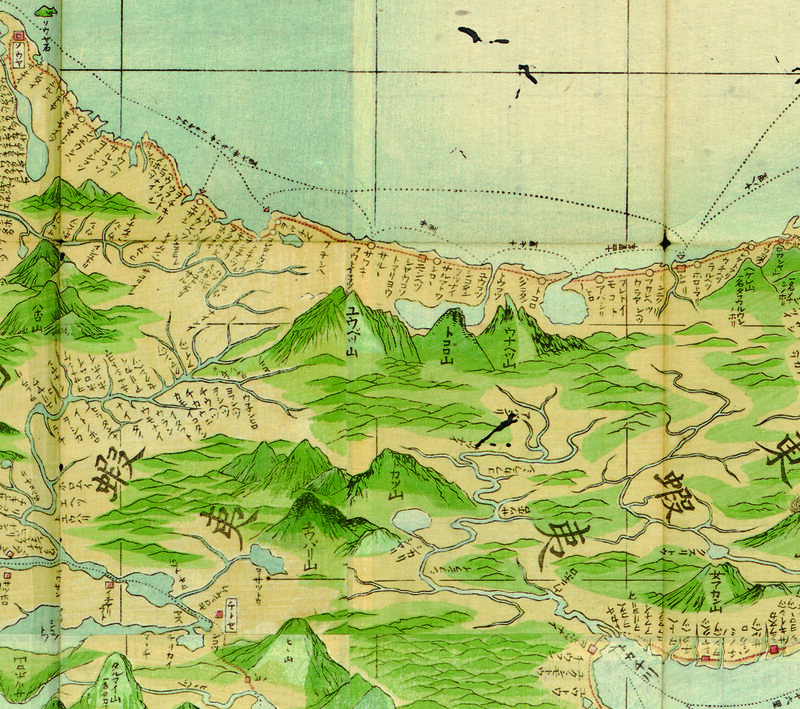
Tonsai Fujita, Ezo Kokyo Yochi Zenzu, Tonsai Fujita Royo, Hashimoto Ransi Shukuzu, 1854. (Photo: The Library of Congress Geography and Map Division)
These are symbols or icons that denote different entities on map, such as schools, churches, highways, restaurants, or airports. This map of the Ezo region of Japan (now Hokkaido), illustrated in 1854, includes yellow circles along the coast line that mark cardinal directions.


When I was in college I had an ancient Roman map of the world which came in 8 pieces and covered an entire wall of my dorm room. I still miss that map (em…. 3 years later…. or thereabouts)
Everyone else has a Klimt, you know. Everyone normal, that is.
Has it been 3 years already? My, does time fly.
I know. I don’t look a day over 12.
Having met you in person, I can attest to that. Oh well, maybe a single day over 12.
Yes. It does. Glad you understand.
I’m a map fan since I was a kid. Love this post!
Thank you 🙂
An interesting and thorough piece, Nicholas. This is true artistry. Well done. —- Suzanne
I love it when science and art come together like this 🙂
What beautiful maps, Nicholas. I love maps – they pull my imagination right into another land. Some great idea here for book mapmaking. 🙂
My feelings exactly! Thank you, D 🙂
I have always loved maps. Even the London A-Z fascinates me, although I know the city well. I was brought up on Mercator’s Projection, but enjoy seeing alternative views too. My favourite here was the 1962 map of New York. Such detail!
If any of you map lovers are ever in London, try this shop.
https://www.stanfords.co.uk/maps-atlases
Best wishes, Pete.
Many thanks for the link, Pete 🙂
The first time when I saw a Medieval map of Italy, I bought this immediately while we were on holiday in Bergamo a couple of years ago. I fell in love with its unique diagram and calligraphy work crafted with hands and not with machine. It was quite expensive, but it was worth to buy it. I had it hang in the study room.
I realized later, after I did research on world map, that the old ancient Medieval maps does not really have the same purpose and meaning as the modern maps of today. The outline of the overall geographic, cosmographic and cartographic activity during the early medieval period in order to place the accompanying monographs in their historical perspective are so amazing.
Unlike the early Greeks and individuals such as Marinus of Tyre and Ptolemy, or even the medieval cartographers of the East (Chinese and Muslim), early Christian (European) medieval cartographers made no use of astronomical observations, nor did scales, latitudes and longitudes find a part in their scheme. Their maps were based upon pre-Ptolemaic and pre-scientific models, which had already become debased and which, in their hands, suffered still further distortion.
But even then, I love these amazing maps done with such care and details, and artistry.
Thank you for sharing this with us, Nicholas!
(✿◠‿◠)
Thank you so much for sharing that, Sherrie! I have an upcoming post that features a Medieval map with a few interesting details 🙂
We found a store in Sarasota that sold beautiful topographical maps of land and waterways laser etched into birch wood. My husband spent his teen years on Siesta Key on the Gulf Coast. We couldn’t resist. It’s hanging on my wall now. We got one for my son in Michigan of the Great Lakes and Michigan. I love to see maps in books. They help me orient on my reading journey.
Sweet! I’d love to get me one of those 🙂
There are several companies that make them online. Our was called The Giving Tree. Here’s one: https://www.belowtheboat.com/ I don’t know if they do overseas ones, but they do make custom ones.
Wow, sweet! Thanks for the link 🙂